The population of Thatcham is a common topic at many local history talks. So in this post we will take a brief look at the population statistics. The first chart below shows the population of Thatcham with information taken from a number of sources. Where possible census records have been used, newspaper reports and estimates from Domesday for example.
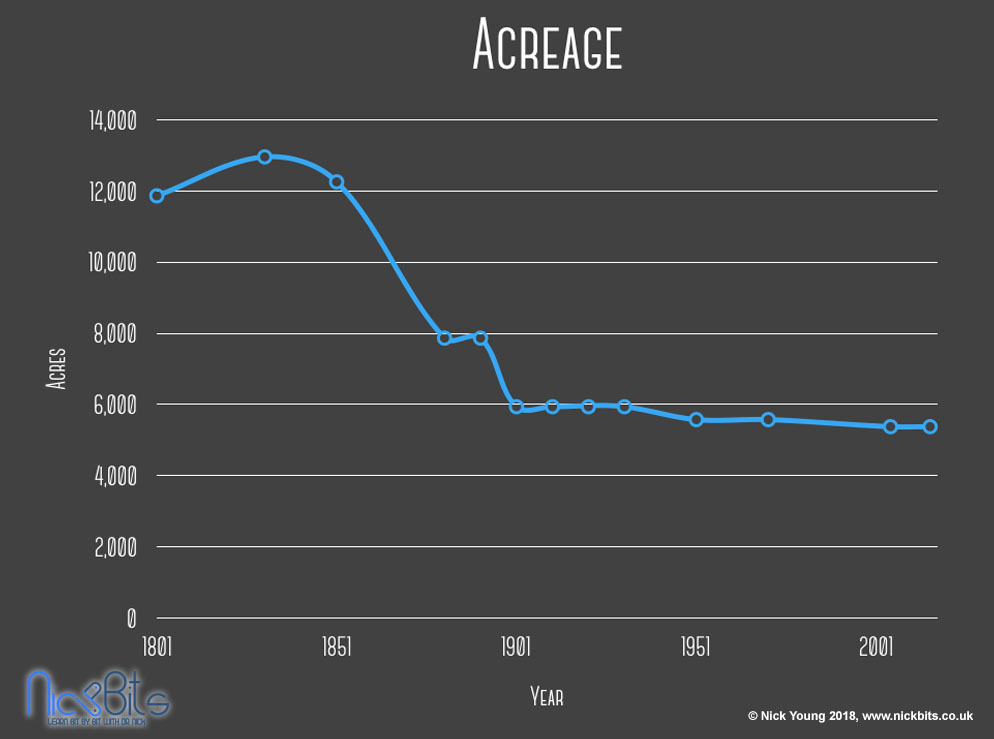
There are gaps in the population where information could not be found. There are also a number of spikes and dips. Some of these coincide with events such as The Plague. Others such as in the 1800’s with boundary changes when a large section, Cold Ash, became a separate parish. The change in the size of Thatcham is charted below.
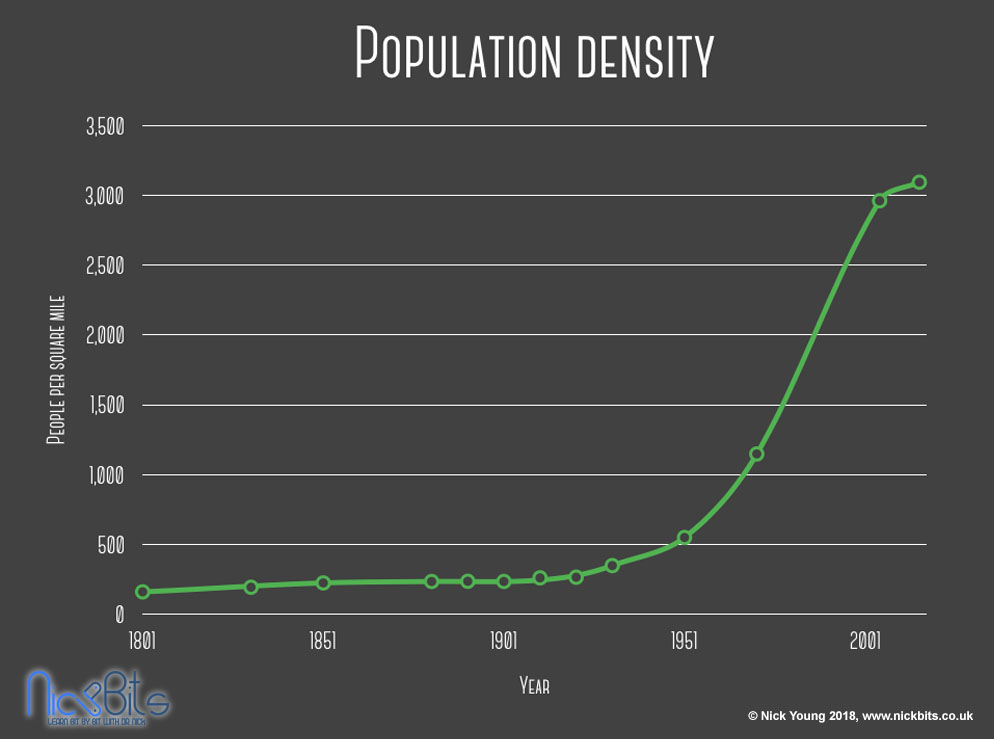
In a future post I will detail some of these changes in borders. Knowing that borders change make it difficult to compare population sizes as you are comparing different areas. Some historians I have spoke to have suggested using the population density to overcome this. Thus I have plotted this below for Thatcham through the ages.
Again though this may look smoother but has the same problem of border changes. The bottom line is whichever method you use to evaluate the population size beware of differences between past boundaries and modern boundaries. You may not be comparing the same or similar.
With Thatcham we can see boundaries have changed little since 1951 but the population density has gone from about 500 people per square mile to over 3,000 people per square mile. More over we can see that despite a shrinking border the density has risen dramatically. The question is will this now level off, slow down or continue to grow?


